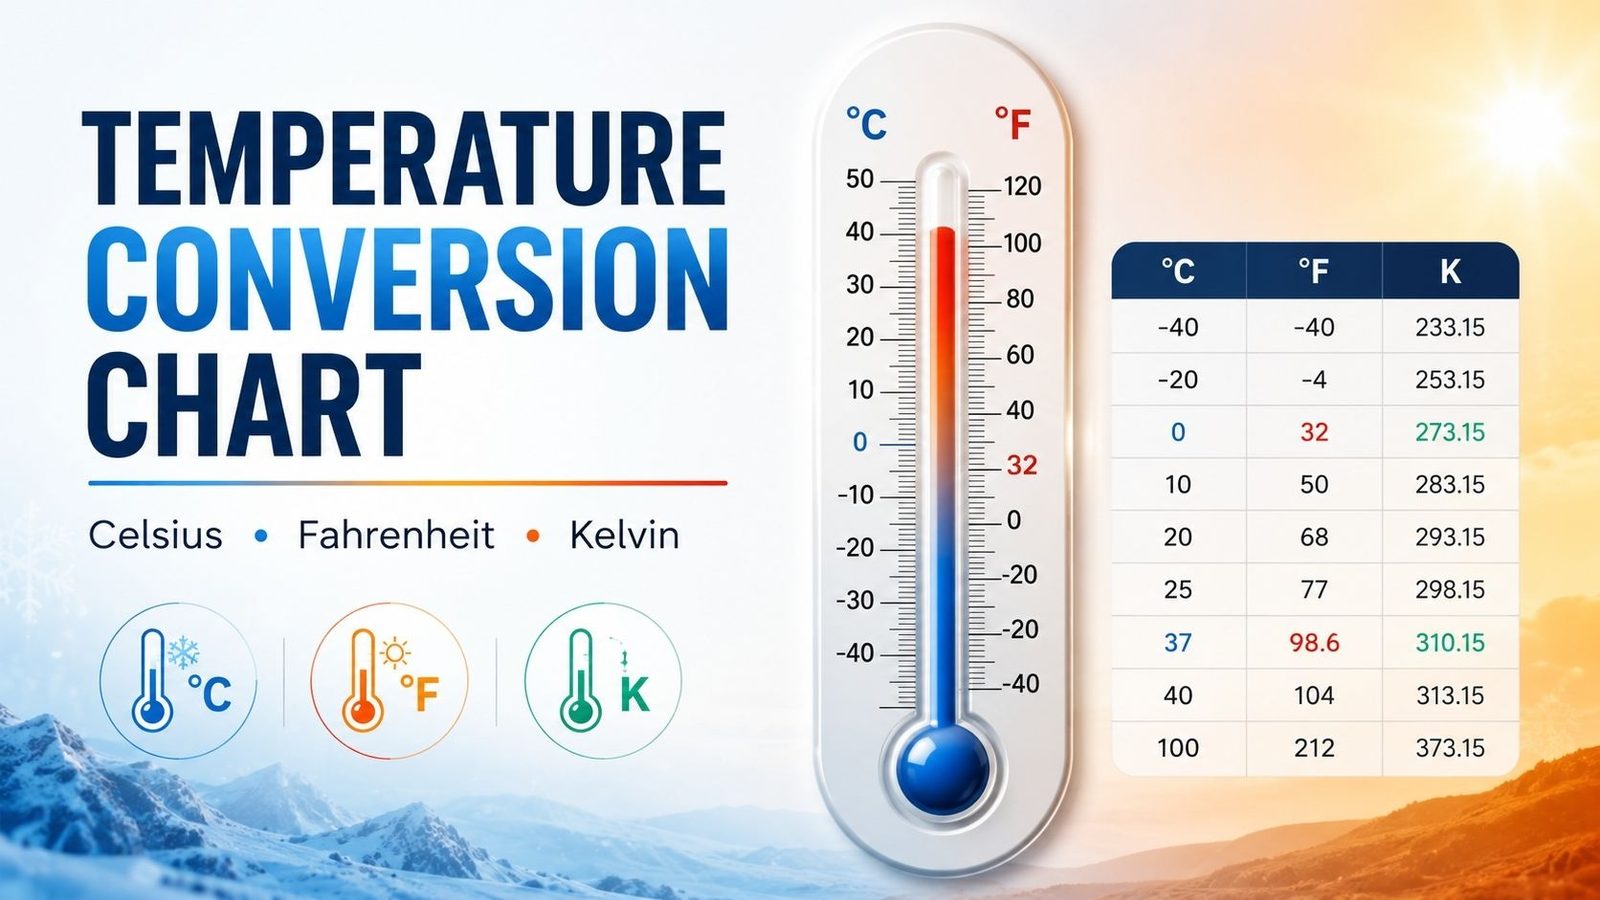
Use this temperature conversion chart to compare common Celsius, Fahrenheit, and Kelvin values at a glance. The table begins at −40°C, where Celsius and Fahrenheit display the same number, and continues to 100°C.
For a temperature that is not shown in the chart, use the exact formulas and worked examples below. Alternatively, choose the appropriate calculator because it provides an immediate result without requiring a manual calculation.
Quick Temperature Reference
The following values provide useful starting points:
- −40°C = −40°F = 233.15 K
- 0°C = 32°F = 273.15 K
- 20°C = 68°F = 293.15 K
- 37°C = 98.6°F = 310.15 K
- 100°C = 212°F = 373.15 K
Although these reference values cover many everyday situations, the complete chart below provides a broader comparison.
Temperature Conversion Chart: Celsius, Fahrenheit and Kelvin
The following chart lists equivalent temperatures in 5-degree Celsius intervals. Therefore, it provides a convenient reference for weather, education, household settings, scientific work, and general temperature comparisons.
| Celsius | Fahrenheit | Kelvin |
|---|---|---|
| −40°C | −40°F | 233.15 K |
| −35°C | −31°F | 238.15 K |
| −30°C | −22°F | 243.15 K |
| −25°C | −13°F | 248.15 K |
| −20°C | −4°F | 253.15 K |
| −15°C | 5°F | 258.15 K |
| −10°C | 14°F | 263.15 K |
| −5°C | 23°F | 268.15 K |
| 0°C | 32°F | 273.15 K |
| 5°C | 41°F | 278.15 K |
| 10°C | 50°F | 283.15 K |
| 15°C | 59°F | 288.15 K |
| 20°C | 68°F | 293.15 K |
| 25°C | 77°F | 298.15 K |
| 30°C | 86°F | 303.15 K |
| 35°C | 95°F | 308.15 K |
| 40°C | 104°F | 313.15 K |
| 45°C | 113°F | 318.15 K |
| 50°C | 122°F | 323.15 K |
| 55°C | 131°F | 328.15 K |
| 60°C | 140°F | 333.15 K |
| 65°C | 149°F | 338.15 K |
| 70°C | 158°F | 343.15 K |
| 75°C | 167°F | 348.15 K |
| 80°C | 176°F | 353.15 K |
| 85°C | 185°F | 358.15 K |
| 90°C | 194°F | 363.15 K |
| 95°C | 203°F | 368.15 K |
| 100°C | 212°F | 373.15 K |
Choosing a Calculator for a Single Value
A chart works best when you want to compare several temperatures. However, when you only need one precise result, the dedicated Celsius to Fahrenheit calculator completes the conversion instantly.
Conversely, when the original value is expressed in Fahrenheit, use the Fahrenheit to Celsius converter. As a result, you can avoid searching through the full table or applying the formula manually.
Common Temperature Reference Points
Long conversion tables are useful when you already know the approximate value. However, familiar reference points make the relationships between the temperature scales easier to understand and remember.
| Reference point | Celsius | Fahrenheit | Kelvin |
|---|---|---|---|
| Absolute zero | −273.15°C | −459.67°F | 0 K |
| Celsius and Fahrenheit are equal | −40°C | −40°F | 233.15 K |
| Freezing point of pure water | 0°C | 32°F | 273.15 K |
| Common room-temperature reference | 20°C | 68°F | 293.15 K |
| Warm weather reference | 30°C | 86°F | 303.15 K |
| Commonly cited average body temperature | 37°C | 98.6°F | 310.15 K |
| Boiling point of pure water at standard atmospheric pressure | 100°C | 212°F | 373.15 K |
Room and body temperature values are approximate references rather than universal fixed values. In addition, the boiling point of water changes with atmospheric pressure and altitude. Therefore, scientific or technical work should always consider the stated measurement conditions.
How to Use This Temperature Conversion Chart
First, find your starting temperature in the appropriate column. Next, move across the same row to see the equivalent Fahrenheit, Celsius, or Kelvin values.
For example, the row containing 25°C also shows 77°F and 298.15 K. Therefore:
25°C = 77°F = 298.15 K
Because the chart uses 5°C intervals, a specific temperature may fall between two rows. In that situation, use the exact formula or the appropriate calculator instead of estimating between the displayed values.
Exact Temperature Conversion Formulas
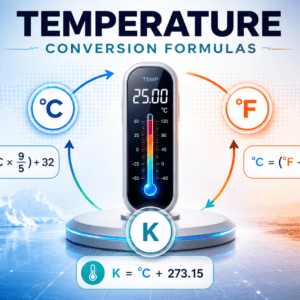
Temperature scales cannot be converted with one universal multiplier because their zero points are different. Moreover, Celsius and Fahrenheit use different interval sizes. Consequently, every conversion direction has its own formula.
| Conversion | Exact formula |
|---|---|
| Celsius to Fahrenheit | °F = (°C × 9/5) + 32 |
| Fahrenheit to Celsius | °C = (°F − 32) × 5/9 |
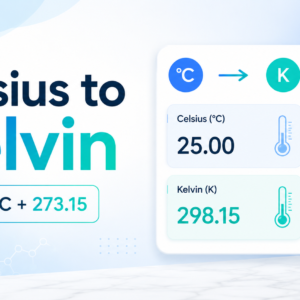
| Celsius to Kelvin | K = °C + 273.15 |
| Kelvin to Celsius | °C = K − 273.15 |
| Fahrenheit to Kelvin | K = (°F − 32) × 5/9 + 273.15 |
| Kelvin to Fahrenheit | °F = (K − 273.15) × 9/5 + 32 |
Converting Between Celsius and Kelvin
Celsius and Kelvin use temperature intervals of the same size. Therefore, converting between them requires only a change in the zero point.
You can add 273.15 manually when converting Celsius to Kelvin. Alternatively, the Celsius to Kelvin converter provides the result immediately.
When the original measurement is already expressed in kelvins, the Kelvin to Celsius calculator subtracts the same offset automatically.
Converting Between Fahrenheit and Kelvin
Fahrenheit and Kelvin have different zero points and interval sizes. Consequently, these conversions require more than one mathematical step.
The Fahrenheit to Kelvin calculator first converts the Fahrenheit value to Celsius and then applies the Kelvin offset. Similarly, the Kelvin to Fahrenheit converter completes both stages automatically.
Finally, remember that Kelvin is written with the symbol K, not °K.
Worked Temperature Conversion Examples
The examples below show how the formulas work step by step. Moreover, each result can be confirmed by using the corresponding calculator.
Example 1: Convert 25°C to Fahrenheit and Kelvin
First, use the Celsius to Fahrenheit formula:
°F = (25 × 9/5) + 32
°F = 45 + 32
°F = 77
Next, convert Celsius to Kelvin:
K = 25 + 273.15
K = 298.15
Therefore:
25°C = 77°F = 298.15 K
Example 2: Convert 68°F to Celsius and Kelvin
First, use the Fahrenheit to Celsius formula:
°C = (68 − 32) × 5/9
°C = 36 × 5/9
°C = 20
Afterward, add 273.15 to the Celsius result:
K = 20 + 273.15
K = 293.15
Consequently:
68°F = 20°C = 293.15 K
Although both stages can be completed manually, the Fahrenheit to Kelvin calculator combines them into one conversion.
Example 3: Convert 300 K to Celsius and Fahrenheit
Begin by subtracting 273.15:
°C = 300 − 273.15
°C = 26.85
Next, convert the Celsius result to Fahrenheit:
°F = (26.85 × 9/5) + 32
°F = 80.33
Thus:
300 K = 26.85°C = 80.33°F
When you only need the final Fahrenheit value, the Kelvin to Fahrenheit converter performs the complete calculation automatically.
Understanding the Three Temperature Scales
Although all three scales measure temperature, they were developed for different purposes. Therefore, their zero points and everyday uses are not identical.
Celsius
Celsius, shown as °C, is widely used for weather forecasts, cooking, household temperatures, and scientific measurements. Under commonly defined standard conditions, pure water freezes at approximately 0°C and boils at approximately 100°C.
Because the scale is based on convenient decimal intervals, Celsius is widely used throughout most of the world.
Fahrenheit
Fahrenheit is written as °F and remains the familiar everyday scale in the United States. On this scale, the freezing point of water is approximately 32°F, while its boiling point is approximately 212°F under standard atmospheric pressure.
Although Fahrenheit is less common internationally, it is still frequently encountered in weather reports, household appliances, and American recipes.
Kelvin
Kelvin is the SI unit of thermodynamic temperature. The scale begins at absolute zero, so 0 K equals −273.15°C.
Unlike Celsius and Fahrenheit, Kelvin does not use a degree symbol. Therefore, write 300 K, not 300°K.
In addition, Kelvin is especially important in physics, chemistry, engineering, and thermodynamics because its zero point represents the lowest possible thermodynamic temperature.
Actual Temperatures and Temperature Differences
Converting an actual temperature requires the complete formula because Celsius and Fahrenheit have different zero points. However, converting a temperature change requires only the interval ratio.
Converting a Temperature Change
A temperature change of 1°C equals a change of 1 K. Meanwhile, the same temperature change equals 1.8°F.
Conversely, a change of 1°F equals a change of 5/9°C.
For example, an increase from 20°C to 25°C is a change of 5°C. Therefore, the equivalent Fahrenheit increase is 9°F, even though the original temperature of 20°C equals 68°F.
Why the Difference Matters
This distinction is particularly important in scientific, engineering, and technical calculations. For instance, adding 32 is necessary when converting an actual Celsius reading to Fahrenheit. However, it is not used when converting only the size of a temperature increase or decrease.
Consequently, identifying whether you are converting a reading or an interval helps prevent calculation errors.
Accuracy and Rounding
For the most accurate result, keep the complete number throughout the calculation and round only the final answer. Otherwise, early rounding may create a larger error, especially when several conversion steps are involved.
Choosing the Correct Number of Decimal Places
Everyday weather temperatures are often rounded to the nearest whole degree. However, laboratory or engineering measurements may require one, two, or more decimal places.
In addition, mathematical conversion does not make the original measurement more precise. Therefore, the final answer should reflect the accuracy of the starting value.
Common Temperature Conversion Mistakes
Even simple conversions can produce incorrect results when the wrong operation is used. Therefore, check the following points before accepting a result:
- Do not add 32 when converting Fahrenheit to Celsius.
- Do not multiply Celsius by 273.15 when converting it to Kelvin.
- Never use a degree symbol with the Kelvin unit.
- Do not treat 273 K as the exact equivalent of 0°C.
- Remember that mathematical accuracy and thermometer accuracy are different.
- Do not enter a thermodynamic Kelvin value below 0 K.
The exact Celsius equivalent of 0 K is −273.15°C. Similarly, 0°C equals exactly 273.15 K.
When Is a Temperature Conversion Chart Useful?
A temperature conversion chart is most helpful when you need to compare several temperatures rather than calculate only one value.
| Situation | Most useful scales |
|---|---|
| International weather forecasts | Celsius and Fahrenheit |
| Travel and everyday conversation | Celsius and Fahrenheit |
| School science and laboratory work | Celsius and Kelvin |
| Thermodynamics and engineering | Kelvin and Celsius |
| American scientific data | Fahrenheit and Kelvin |
| Cooking and appliance instructions | Celsius and Fahrenheit |
| Refrigeration and HVAC | Celsius and Fahrenheit |
Everyday and Travel Use
When travelling, you may encounter a weather forecast expressed in an unfamiliar unit. Therefore, comparing Celsius and Fahrenheit can make local conditions easier to understand.
Similarly, conversion is useful when reading foreign appliance settings, product instructions, or household recommendations.
Scientific and Technical Use
Kelvin is commonly used in scientific work because it begins at absolute zero. In addition, Celsius remains useful when measurements need to relate more directly to familiar environmental conditions.
Engineering and HVAC documents may use different units depending on the country. Consequently, a reliable chart or calculator can prevent misunderstandings.
Cooking and Oven Temperatures
For cooking, mathematical conversion does not account for fan-assisted ovens, thermostat calibration, Gas Mark settings, or variations in appliance performance. Therefore, a dedicated oven temperature chart is usually more practical for recipes.
Calculation Method and Review
Every value in this temperature conversion chart was calculated with the exact Celsius, Fahrenheit, and Kelvin relationships shown above.
In addition, the results were checked at important reference points, including absolute zero, −40 degrees, the freezing point of water, and the boiling point of water at standard atmospheric pressure.
Accuracy note: Mathematical conversion does not increase the precision of the original measurement. Therefore, the number of decimal places in the final result should reflect the accuracy required for the task.
Last reviewed: July 2026.
A temperature conversion chart is a reference table that displays equivalent values from two or more temperature scales on the same row. It allows you to compare Celsius, Fahrenheit, and Kelvin without calculating every value manually.
Celsius and Fahrenheit display the same number at −40 degrees. Therefore:
−40°C = −40°F
Multiply the Celsius value by 9/5 and add 32. For example, 20°C equals 68°F. For a quick result without manual calculation, use the Celsius to Fahrenheit calculator linked above.
Subtract 32 from the Fahrenheit value, then multiply the result by 5/9. For instance, 86°F converts to 30°C.
Add 273.15 to the Celsius temperature. Thus, 25°C equals 298.15 K.
No. Write 300 K rather than 300°K. Celsius and Fahrenheit use degree symbols, while Kelvin uses only the unit symbol K.
Using the exact formulas, 100°F is approximately 37.78°C and 310.93 K.
Water boils at approximately 100°C or 212°F at standard atmospheric pressure. However, lower atmospheric pressure at higher altitudes reduces the boiling temperature, while greater pressure raises it.
The numerical Celsius and Fahrenheit relationships remain valid. However, oven settings may also depend on fan operation, calibration, heat distribution, and recipe rounding. Therefore, a dedicated oven temperature chart is more practical for cooking.